Wow, we cannot believe we are zooming into the middle of January already! Our first week back was terrific--slow to get things finished--but terrific all the same.
We just wanted to quickly share a couple of graphing activities and programs we did with our math groups. One of the end goals with my particular lesson, was to have my students teach Anne's students a new graphing program. Up until this point, my math group has not had the opportunity to be the "teachers."
Anne and I introduced our students to collecting data, making tally tables, and putting the information into bar graphs before winter break. We showed the BrainPop Jr. video on graphs, and did an old Everyday Math graphing lesson. The lesson was fun because it had to do with how many letters were in our first or last names. We also introduced the students to analyzing the data to find the minimum and maximum numbers, range, median, and mode. On a side note, there is a more advanced version of graphs in Brain Pop.

At that point, Anne's math group was then ready to generate questions and categories about favorite winter activities. They collected data from their own math group, as well as from my math group. They made their own tally tables to record the information they gathered, and they entered the information into Google Sheets to create a bar graph. Once the graphs were complete, groups of students analyzed the information wrote three statements about it.


After winter break, I wanted to make my groups' graphing experience a bit more concrete. As a whole class, we graphed how many of each Christmas-shaped eraser were in a bag. We first made a tally chart so we could record our information. Then, we dumped the shapes onto the carpet. One by one the students took turns picking out an eraser from the pile, and we all recorded a tally in the correct column on our tally table. The students were focused from the word "Go," because of the novelty of this math lesson, as well as the movement.
The students had more fun using the program Create A Graph, to enter the data and create a bar graph. They loved choosing different colors for the bars and seeing the words and numbers morph into a graph! Once the graphs were printed, we looked at the information and wrote statements about what we noticed, including the minimum and maximum numbers, range and median number.

Then it was time for the kids to do the exact same activity in small groups. This time, the erasers were just a mix of various shapes. Below are pictures.


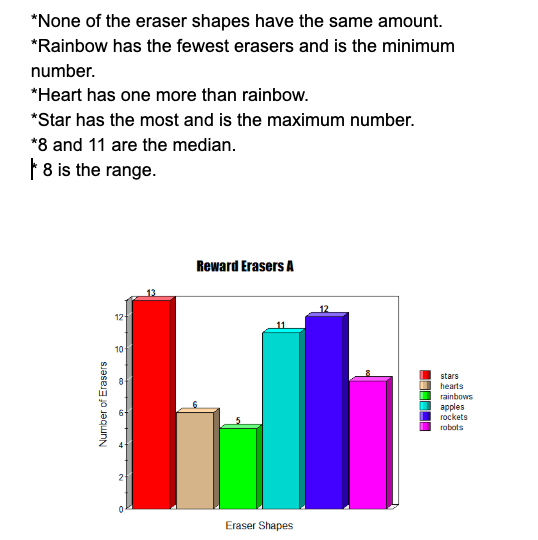 |
| This is one of the group's graphs from Create A Graph. |
Friday, Anne's group of students taught my students how to generate a question and categories about winter, create a tally table, and survey the kids in the room. Monday, my students will show Anne's students how to enter the information into Create A Graph, download it to their drive and print it. Together, they will analyze their information. I will add pictures to this post tomorrow night, as long as everything comes together as planned.
We will also show them two other videos we just found from Maths With Jacob. I really like the graphing video because it gives a quick overview about different types of graphs. As a morning warm-up, the students will answer questions about a line plot graph. They will have learned about it from the video, and I took a screen shot of a line plot poster from A Math's Dictionary For Kids. This will give the students further information about line plots so they can complete the warm-up.


 |
| Created by Jenny Eather. |
Knowing how much fun the next few days in math are going to be, Anne and I cannot wait for math time. Tuesday, we will begin our Snowman STEM activity that introduces/reviews 3-D shapes to the kids.
Have a great week!
Kim and Anne
No comments:
Post a Comment